


Copyright  2008 The American Society of Human Genetics. All rights reserved.
The American Journal of Human Genetics, Volume 82, Issue 4, 873-882, 28 March 2008
doi:10.1016/j.ajhg.2008.01.020
Article
Y-Chromosomal Diversity in Lebanon Is Structured by Recent Historical Events
Pierre A. Zalloua1, Yali Xue2,Jade Khalife1,Nadine Makhoul1,Labib Debiane1,Daniel E. Platt3,Ajay K. Royyuru3,Rene J. Herrera4,David F. Soria Hernanz5,Jason Blue-Smith5,R. Spencer Wells5,David Comas6,Jaume Bertranpetit6,Chris Tyler-Smith2,
 ,
, ,The Genographic Consortium7
1 The Lebanese American University, Chouran, Beirut 1102 2801, Lebanon
2 The Wellcome Trust Sanger Institute, Wellcome Trust Genome Campus, Hinxton, Cambs, CB10 1SA, UK
3 Bioinformatics and Pattern Discovery, IBM T. J. Watson Research Center, Yorktown Hgts, NY 10598, USA
4 Department of Biological Sciences, Florida International University, Miami, FL 33199, USA
5 The Genographic Project, National Geographic Society, Washington, DC 20036, USA
6
Unitat de Biologia Evolutiva, Departament de Ciènces Experimentals i de
la Salut, Universitat Pompeu Fabra, Doctor Aiguader 88, 08003
Barcelona, Catalonia, Spain
Corresponding author7 See Supplemental Data.
Lebanon
is an eastern Mediterranean country inhabited by approximately four
million people with a wide variety of ethnicities and religions,
including Muslim, Christian, and Druze. In the present study, 926
Lebanese men were typed with Y-chromosomal SNP and STR markers, and
unusually, male genetic variation within Lebanon was found to be more
strongly structured by religious affiliation than by geography. We
therefore tested the hypothesis that migrations within historical times
could have contributed to this situation. Y-haplogroup J (xJ2)
was more frequent in the putative Muslim source region (the Arabian
Peninsula) than in Lebanon, and it was also more frequent in Lebanese
Muslims than in Lebanese non-Muslims. Conversely, haplogroup R1b was
more frequent in the putative Christian source region (western Europe)
than in Lebanon and was also more frequent in Lebanese Christians than
in Lebanese non-Christians. The most common R1b STR-haplotype in
Lebanese Christians was otherwise highly specific for western Europe
and was unlikely to have reached its current frequency in Lebanese
Christians without admixture. We therefore suggest that the Islamic
expansion from the Arabian Peninsula beginning in the seventh century
CE introduced lineages typical of this area into those who subsequently
became Lebanese Muslims, whereas the Crusader activity in the 11th
(xJ2)
was more frequent in the putative Muslim source region (the Arabian
Peninsula) than in Lebanon, and it was also more frequent in Lebanese
Muslims than in Lebanese non-Muslims. Conversely, haplogroup R1b was
more frequent in the putative Christian source region (western Europe)
than in Lebanon and was also more frequent in Lebanese Christians than
in Lebanese non-Christians. The most common R1b STR-haplotype in
Lebanese Christians was otherwise highly specific for western Europe
and was unlikely to have reached its current frequency in Lebanese
Christians without admixture. We therefore suggest that the Islamic
expansion from the Arabian Peninsula beginning in the seventh century
CE introduced lineages typical of this area into those who subsequently
became Lebanese Muslims, whereas the Crusader activity in the 11th 13th centuries CE introduced western European lineages into Lebanese Christians.
(xJ2)
was more frequent in the putative Muslim source region (the Arabian
Peninsula) than in Lebanon, and it was also more frequent in Lebanese
Muslims than in Lebanese non-Muslims. Conversely, haplogroup R1b was
more frequent in the putative Christian source region (western Europe)
than in Lebanon and was also more frequent in Lebanese Christians than
in Lebanese non-Christians. The most common R1b STR-haplotype in
Lebanese Christians was otherwise highly specific for western Europe
and was unlikely to have reached its current frequency in Lebanese
Christians without admixture. We therefore suggest that the Islamic
expansion from the Arabian Peninsula beginning in the seventh century
CE introduced lineages typical of this area into those who subsequently
became Lebanese Muslims, whereas the Crusader activity in the 11th13th centuries CE introduced western European lineages into Lebanese Christians.Introduction
Compared with other ape species, humans show little genetic variation, despite their much larger population size and wider distribution, and this limited variation can mostly be explained by geographical factors.1 Human populations, however, can be classified in many other ways, such as by language, ethnicity, or religion. Populations in which these alternative factors have had a greater influence than geography on the distribution of genetic variation are unusual and merit particular attention. Here, we describe the genetic structure of the peoples of Lebanon, show that religion has had a strong influence on current patterns of patrilineal variation, and identify historical events that might underlie this unusual situation.
Lebanon is a small country on the eastern coast of the Mediterranean (Figure1).
Just 4,015 square miles in area, it is 1/60th the size of Texas and
half the size of Wales. This region was first occupied by fully modern
humans  47,000 years ago1 and appears to have remained habitable even during the unfavorable conditions of the last glacial maximum 18,00021,000 years ago.2 It is close to the Fertile Crescent where the West Asian Neolithic transition began 10,000 years ago1, was conquered by the Assyrians, Babylonians, Persians, and Romans, and was visited by the Egyptians and Greeks.3, 4, 5, 6
Among well-documented events within more recent historical times, three
could potentially have involved significant immigration into the
country. First, the Muslim expansion beginning in the 7th century CE introduced the Islamic faith from its origin in the Arabian Peninsula.7 Second, in the 11th13th centuries CE, the Crusades resulted in the establishment of enclaves by substantial numbers of European Christians. 3, 4, 5, 7, 8 Finally, in the 16th century CE, the Ottoman Empire expanded into this region and remained until the early part of the 20th century.3
The current Lebanese population of almost four million people thus
consists of a wide variety of ethnicities and religions, including
Muslim, Christian, Druze, and others.
47,000 years ago1 and appears to have remained habitable even during the unfavorable conditions of the last glacial maximum 18,00021,000 years ago.2 It is close to the Fertile Crescent where the West Asian Neolithic transition began 10,000 years ago1, was conquered by the Assyrians, Babylonians, Persians, and Romans, and was visited by the Egyptians and Greeks.3, 4, 5, 6
Among well-documented events within more recent historical times, three
could potentially have involved significant immigration into the
country. First, the Muslim expansion beginning in the 7th century CE introduced the Islamic faith from its origin in the Arabian Peninsula.7 Second, in the 11th13th centuries CE, the Crusades resulted in the establishment of enclaves by substantial numbers of European Christians. 3, 4, 5, 7, 8 Finally, in the 16th century CE, the Ottoman Empire expanded into this region and remained until the early part of the 20th century.3
The current Lebanese population of almost four million people thus
consists of a wide variety of ethnicities and religions, including
Muslim, Christian, Druze, and others.
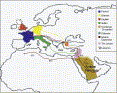
Figure1
Map of Lebanon and Its Surrounding Regions Showing Historically Documented Migrations into Lebanon1The Y chromosome carries the largest nonrecombining segment in the human genome, and consequently its haplotypes provide a rich source of information about male history.9 We set out to establish the extent of Y-chromosomal variation in Lebanon to determine whether this varies between subpopulations identified on the basis of geographical origin or religious affiliation and, if it does, to what extent such variation could be related to known historic or prehistoric events.
Material and Methods
Subjects and Comparative Datasets
We sampled 926 Lebanese men who had three generations of paternal ancestry in the country and who gave informed consent for this study, which was approved by the American University of Beirut IRB Committee. Each provided information on his geographical origin, classified into five regions: (1) Beirut (the capital city), (2) Mount Lebanon in the center, (3) the Bekaa Valley in the east, (4) the north, and (5) the south. Each also provided information on his religious affiliation: (1) Muslim, including the sects Shiite and Sunnite, (2) Christian, including the major sects Maronite, Orthodox, and Catholic, and (3) Druze, a distinct religion that has a 1000-year history and whose followers live mainly in Syria and Lebanon.
Comparative data on haplogroup frequencies were obtained from published sources and consenting individuals from the Genographic Public Participation dataset, whose participants can choose to make their data available for subsequent studies. For the Arabian Peninsula, published data from Omani Arabs10, Qatar, United Arab Emirates, and Yemen11 were used; in addition, we used data from the Genographic Public Participation dataset for individuals originating from Oman, Qatar, United Arab Emirates, Yemen, and Saudi Arabia ( Supplemental Data in the Supplemental Data). Data from France12, Germany13, England14, and Italy15 were used to construct a representative western European sample as described below, and data from Turkey were also available.16
Combined Y-SNP plus Y-STR datasets were available from the Arabian Peninsula10, 11 and Turkey16. European data were extracted from the consented Genographic Project Public Participation database ( Supplemental Data).
Historical Data
In addition to the contemporary subjects, we needed estimates ofthe likely genetic composition of the Crusaders. Historical sources17, 18, 19 show that four Crusades reached Lebanon the first, second, third, and sixthand
that the main populations contributing were the French, Germans,
English, and Italians; these sources suggest that the approximate
numbers of men participating from the four countries were similar (Table 1). Y haplogroup frequencies are known in each of these modern populations12, 13, 14, 15,
so if we assume that haplogroup frequencies were similar at the time of
the Crusades, a weighted average western European haplogroup
composition can be constructed (Table 2).
This needed to be provided as numbers rather than frequencies for the
tests described below. We therefore first scaled the total contribution
from each country according to the smallest sample (the French12, n=45) to produce the
the first, second, third, and sixthand
that the main populations contributing were the French, Germans,
English, and Italians; these sources suggest that the approximate
numbers of men participating from the four countries were similar (Table 1). Y haplogroup frequencies are known in each of these modern populations12, 13, 14, 15,
so if we assume that haplogroup frequencies were similar at the time of
the Crusades, a weighted average western European haplogroup
composition can be constructed (Table 2).
This needed to be provided as numbers rather than frequencies for the
tests described below. We therefore first scaled the total contribution
from each country according to the smallest sample (the French12, n=45) to produce the  weighted total
 column in Table 2.
We then divided each weighted total by the haplogroup frequency in that
country to give a weighted number for each haplogroup from each
country. Finally, we calculated the sum of these weighted numbers for
each haplogroup and used the closest integer (bottom row in Table 2) in the analyses below.
column in Table 2.
We then divided each weighted total by the haplogroup frequency in that
country to give a weighted number for each haplogroup from each
country. Finally, we calculated the sum of these weighted numbers for
each haplogroup and used the closest integer (bottom row in Table 2) in the analyses below.
| Table 1 Numbers of Men Contributing to Each of the Crusades that Reached Lebanon According to Historical Sources17, 18, 19 |
| Country | 1st Crusade | 2nd Crusade | 3rd Crusade | 6th Crusade | Total | Proportion | ||
|---|---|---|---|---|---|---|---|---|
| French | 40,000 | 15,000 | 20,000 | 0 | 75,000 | 0.28 | ||
| German | 23,000 | 15,000 | 1,000 | 25,000 | 64,000 | 0.24 | ||
| English | 23,000 | 15,000 | 30,000 | 0 | 68,000 | 0.26 | ||
| Italian | 59,000 | 0 | 0 | 0 | 59,000 | 0.22 | ||
| Total | 145,000 | 45,000 | 51,000 | 25,000 | 266,000 | 1.00 | ||
| Table 2 Construction of a Western European Y Haplogroup Sample Weighted According to the Relative Contribution from Each Country |
| E3b | G | I | J(xJ2) | J2 | K2 | L | R1b | Other | Total | Weighted total | |||
|---|---|---|---|---|---|---|---|---|---|---|---|---|---|
| European Y-Chromosomal Haplogroup Numbers from Previous Studies | |||||||||||||
| French12 | 2 | 0 | 6 | - | 4 | 0 | 0 | 31 | 2 | 45 | 45 | ||
| Germans13 | 75 | -a | 287 | - | 49 | - | - | 473 | 331 | 1215 | 38.4 | ||
| English14 | 24 | - | 163 | 3 | 25 | - | - | 616 | 45 | 876 | 40.8 | ||
| Italians15 | 88 | 75 | 52 | 14 | 140 | - | - | 280 | 50 | 699 | 35.4 | ||
| 159.6 | |||||||||||||
| Weighted Numbers Used | |||||||||||||
| French | 2 | 0 | 6 | 0 | 4 | 0 | 0 | 31 | 2 | 45 | |||
| German | 2.4 | 0 | 9.1 | 0 | 1.5 | 0 | 0 | 14.9 | 10.5 | 38.4 | |||
| English | 1.1 | 0 | 7.6 | 0.1 | 1.2 | 0 | 0 | 28.7 | 2.1 | 40.8 | |||
| Italy | 4.5 | 3.8 | 2.6 | 0.7 | 7.1 | 0 | 0 | 14.2 | 2.5 | 35.4 | |||
| Western European combined | 9.9 | 3.8 | 25.3 | 0.8 | 13.8 | 0 | 0 | 88.8 | 17.1 | 159.6 | |||
| Western European (integer) | 10 | 4 | 25 | 1 | 14 | 0 | 0 | 89 | 17 | 160 | |||
| a Rare haplogroup not typed in the relevant study; value set to zero. |
Genotyping
Samples were genotyped with a set of 58 Y-chromosomal binary markers by standard methods20 (Figure2).
These markers define 53 haplogroups (including paragroups), 27 of which
were present in the Lebanese sample. We also typed a subset (the first
587 individuals collected, and thus with unbiased ascertainment) with
11 Y-STRs by using standard methods21, 22 ( Supplemental Data). STR alleles were named according to current recommendations23, except that 389b was used in place of DYS389II; 398b = (DYS389II  DYS389I).

Figure2
Y-Chromosomal Haplogroups Identified in Lebanese Subpopulations2The phylogenetic tree defined by the markers used is shown on the left, and the haplogroup names are given in the middle. Nomenclature is based on the 2003 YCC tree9, with departures indicated by
/-. The absolute number of chromosomes within each haplogroup in the entire sample is shown in the Lebanon
column, and the relative frequency within each of the three religious
groups is shown on the right by the relative sizes of the circles.General Statistical Analyses
Analysis of molecular variance (AMOVA)24, population pairwise genetic distances, and Mantel tests25 were performed with the package Arlequin 3.11.26 Admixture analyses were carried out with Admix2_0.27 Median-joining networks28 were calculated with Network 4.2 (Fluxus-Engineering). Such networks were highly reticulated, and we reduced reticulations by first weighting the loci according to the inverse of their variance in the dataset used29 and subsequently constructing a reduced-median network30 to form the input of the median-joining network. Male effective population sizes were calculated with BATWING31 with a demographic model that assumed a period of constant size followed by exponential growth; prior values were set for other parameters as described previously.20
Computation of Drift Probabilities
We wished to calculate the probability that a haplotype could increase from a deduced initial frequency to an observed current frequency by chance over a period specified by the historical record. In addition, we wished to evaluate the influence that admixture with an outside population might have on this probability. We had detailed data consisting of Y-SNP and Y-STR sets for some relevant groups and relied upon the YHRD database for data from other populations. A number of applications are available for estimating migration rates; these applications account for coalescence, mutation, and migration, including estimates of variation of migration, over a period of time.32, 33, 34, 35, 36, 37, 38 However, none of the packages address the specific question of testing whether drift alone could reasonably account for the emergence of modern levels of haplogroup or haplotype frequencies in the population or how much migration for a specified epoch could affect these rates if the available historical information is incorporated. We have therefore chosen to directly employ a Wright-Fisher model with sampled migration to compute the effects of drift given an admixture event of known duration.
The Wright-Fisher model39, 40 entirely replaces each generation with each succeeding one. The offspring select their parents randomly. The following calculation outlines the Wright-Fisher drift model, describing how the probability of seeing some particular number of members of a population carrying a haplotype will evolve over time. Then it considers the following circumstance: Two populations are evolving according to the Wright-Fisher model and the island model of Haldane41. First, a European population carrying a particular haplotype of interest described below (Western European Specific 1, WES1) experiences drift freely. Over some period of time, some number of this population is selected randomly and travels to Lebanon. Each generation, the children randomly select their parents from the mixed Lebanese and migrant European populations.
Given that a proportion p parents are of some particular haplotype, the probability that the selected number X(t + 1) of l children out of an effective population of size N is  . Given that j out of N parents are of the haplotype of interest, then p = j/N. Therefore, the probability of finding l children of the haplotype of interest given j parents is
  .
.
Given a distribution of probabilities P(X(t) = j) of finding j children of the haplotype of interest at some generation t, the probability P(X(t + 1) = l) of finding l of the haplotype at time t + 1 is  . The chances pf of finding at least some fraction f of that haplotype after t = T generations is
  .
.
We
can extend the above argument to include the admixture of one
population with another if we replace the population sampled by the
children with an expanded pool that includes contributions from the
incoming population. In this case, a population labeled W carrying among them members of the WES1 haplotype mixes with a native Lebanese population labeled L. Given an effective population NL of Lebanese Christians and an effective population NW of Europeans, the fraction of migrants from which the next generation can choose will be  . The fraction of Lebanese Christians bearing the WES1 marker will be
  , and that of Europeans willbe
  . The total admixed fraction of WES1 presentedtothe next generation will be
  .
.
The number of WES1 individuals, jW, that traveled to Lebanon is a random variable XW(t) that will have a distribution determined by sampling NW admixing WES1 members from the European population, which itself is experiencing drift with probability P(XE(t) = jE) in an effective European population NE. Therefore, the distribution of jW will be determined by  . Then the admixed probability
  that l children will have selected WES1 parents from NL Lebanese and NW WES1 parents is
  . If we sum over the distributions of jL and jL, the final probability distribution of possible future selections of WES1 by the children will be
  . The initial condition of finding p0 assumed as an initial Lebanese fraction of the WES1 marker is specified by requiring
  .
.
Computations were performed in C++ with the binomial distribution function implemented in the Gnu Scientific Library.42
Results
Genetic Structure within Lebanon
The Lebanese sample was subdivided geographically into five subpopulations: one from the capital city, Beirut, and four from other geographically distinct regions that included the Bekaa in the east, the north, the south, and the central Mount Lebanon. After excluding the Beirut individuals because of their diverse recent origins, we estimated the proportions of variation within and between the geographical subpopulations on the basis of the haplogroup frequencies (Table 3). Even within this small geographical area, a highly significant proportion of the variation (0.39%, p < 0.01) was found between the regions, a conclusion reinforced by the finding that genetic distances were significantly greater than zero between several of the pairs of subpopulations when either Y-SNPs or Y-STRs were used (Table 4). The total Lebanese sample could also be subdivided according to religion (Muslim, Christian, or Druze) or religious sect (Shiite, Sunnite, Maronite, or Druze). Using these categories, we found that the proportion of variation between the subpopulations was more than three times higher (1.42%, 1.32%, both p < 0.01; Table 3) than between the geographic regions. Again, many of the genetic distances between religious groups or sects were significant (Table 4). The divisions are not independent because the religious communities show geographical clustering, and when allowance was made for religious affiliation (Muslim, Christian, Druze), a Mantel test25 showed that no additional variation was explained by geographical factors (the four regions).
| Table 3 Variation in Y-Chromosomal Haplogroup Frequencies between Subpopulations within Lebanon |
| Basis of Division | Populations | Percentage of Variation | |||
|---|---|---|---|---|---|
| Within Populations | Among Populations | ||||
| Geography | Bekaa, Mt. Lebanon, North, South | 99.61 | 0.39a | ||
| Religious affiliation | Muslim, Christian, Druze | 98.58 | 1.42a | ||
| Sect | Shiite, Sunnite, Maronite, Druze | 98.68 | 1.32a | ||
| Variation was determined by an analysis of molecular variance. |
| a p < 0.01. |
| Table 4 Pairwise Genetic Distances between Lebanese Subpopulations |
| Pairwise FST (SNPs) | |||||||
|---|---|---|---|---|---|---|---|
| Geographical region | Beirut | Bekaa | Mt. Lebanon | North | |||
| Bekaa | 0.0028 | ||||||
| Mt. Lebanon | 0.0075b | 0.0012 | |||||
| North | 0.0086b | 0.0004 | 0.0033b | ||||
| South | 0.0020 | 0.0029 | 0.0101b | 0.0047b | |||
| Religion | Christian | Druze | |||||
| Druze | 0.0117b | ||||||
| Muslim | 0.0147b | 0.0145b | |||||
| Sect | Druze | Maronite | Shiite | ||||
| Maronite | 0.0166b | ||||||
| Shiite | 0.0186b | 0.0195b | |||||
| Sunnite | 0.0115b | 0.0145b | 0.0000 | ||||
Pairwise  ST (STRs) ST (STRs) | |||||||
| Geographical region | Beirut | Bekaa | Mt. Lebanon | North | |||
| Bekaa | 0.0071 | ||||||
| Mt. Lebanon | 0.0099a | 0.0056 | |||||
| North | 0.0063 | 0.0037 | 0.0042 | ||||
| South | 0.0001 | 0.0001 | 0.0081a | 0.0061a | |||
| Religion | Christian | Druze | |||||
| Druze | 0.0060 | ||||||
| Muslim | 0.0117a | 0.0073 | |||||
| Sect | Druze | Maronite | Shiite | ||||
| Maronite | 0.0041 | ||||||
| Shiite | 0.0071 | 0.0179b | |||||
| Sunnite | 0.0134 | 0.0133b | 0.0001 | ||||
| a p < 0.05. b p < 0.01. |
Identification of Potential Sources for Lebanese Genetic Structure
Because
religious affiliation has the greatest impact on the patterns of
genetic variation in Lebanese populations, and because these religions
have originated within historical times, we first sought explanations
for the genetic differences from the documented historical migrations:
Muslim, Crusader, and Ottoman (Figure1).
Using historical evidence, we identified source regions for these
migrations in the Arabian Peninsula, western Europe, and Turkey,
respectively. We then collected suitable Y-chromosomal SNP datasets
from these areas. For the Arabian Peninsula and Turkey this was simple,
and data from France, Germany, England, and Italy15 were used to construct a suitable western European sample as described in the Material and Methods
section. Because we needed to compare the Lebanese data with the same
haplogroups in these additional datasets, we combined some related
haplogroups to form eight haplogroups [E3b, G, I, J(xJ2),
J2, K2, L, and R1b] that were each present in Lebanon at > 4%,
together accounted for 90% of the Lebanese sample, and could be
compared with the categories used by other authors (Table 5).
| Table 5 Haplogroup Fequencies in Lebanon and Potential Source Populations |
| E3b | G | I | J(xJ2) | J2 | K2 | L | R1b | Other | Total | |||
|---|---|---|---|---|---|---|---|---|---|---|---|---|
| Lebanon (number) | 148 | 60 | 44 | 184 | 237 | 43 | 48 | 74 | 97 | 935 | ||
| Lebanon (frequency) | 0.158 | 0.064 | 0.047 | 0.197 | 0.253 | 0.046 | 0.051 | 0.079 | 0.104 | |||
| Arabian Peninsula (number) | 51 | 12 | 0 | 196 | 43 | 18 | 8 | 9 | 96 | 433 | ||
| Arabian Peninsula (frequency) | 0.118 | 0.028 | 0.000 | 0.453 | 0.099 | 0.042 | 0.018 | 0.021 | 0.222 | |||
| p value Arabian Peninsula v Lebanon | 0.0481 | 0.0049 | 0.0000 | 0.0000a | 0.0000 | 0.7126 | 0.0043 | 0.0000 | ||||
| Western Europeans (estimated number) | 10 | 4 | 25 | 1 | 14 | 0 | 0 | 89 | 17 | 160 | ||
| Western Europeans (estimated frequency) | 0.063 | 0.025 | 0.156 | 0.006 | 0.088 | 0.000 | 0.000 | 0.556 | 0.106 | |||
| p value W. Europeans vs. Lebanon | 0.0014 | 0.0274 | 0.0000a | 0.0000 | 0.0000 | 0.0056 | 0.0033 | 0.0000a | ||||
| Turkey (number) | 56 | 57 | 28 | 48 | 127 | 13 | 22 | 83 | 89 | 523 | ||
| Turkey (frequency) | 0.107 | 0.109 | 0.054 | 0.092 | 0.243 | 0.025 | 0.042 | 0.159 | 0.170 | |||
| p value Turkey vs. Lebanon | 0.0068 | 0.0025 | 0.5839 | 0.0000 | 0.6523 | 0.0440 | 0.4270 | 0.0000a | ||||
| a Significantly higher in source after Bonferroni correction. |
A
standard approach to determining whether migration from these countries
might have contributed to the Lebanese population would be to perform
an admixture analysis with the putative source as one parental
population. Taking such an approach, we could identify possible
contributions from the Arabian Peninsula to Lebanese Muslims and from
western Europe to Lebanese Christians, but the uncertainties in the
estimates were large, and no meaningful result was obtained when Turkey
was used as a potential source (Table 6).
In order to investigate further, we then compared individual haplogroup
frequencies in Lebanon and the putative source regions, and we
identified haplogroups that differed significantly in frequency by
using a Chi-square test with a Bonferroni correction for multiple
testing. A number of haplogroups were found at significantly higher
frequency in the potential source region than in Lebanon: J(xJ2) in the Arabian Peninsula, I and R1b in the western European sample, and R1b in Turkey (Table 5).
Because the extent to which the western European sample used here might
represent the Crusaders is uncertain, we investigated the sensitivity
of our conclusion to the composition of this sample. Haplogroups I and
R1b were both present at higher frequency in each of the individual
populations, and the difference was significant for R1b in all four
populations and for I in two of them (Germans and English). No other
haplogroup was at a significantly higher frequency in any of the
individual populations than in Lebanon. We therefore conclude that this
is a robust finding.
| Table 6 Admixture Analyses |
| Parental 1 | Parental 2 | Admixed | Parental 1 Contribution | ||
|---|---|---|---|---|---|
| Arabian Peninsula | Lebanese non-Muslims | Lebanese Muslims | 37%, SD 11% | ||
| Western Europe | Lebanese non-Christians | Lebanese Christians | 10%, SD 7% | ||
| Turkey | Lebanese non-Muslims | Lebanese Muslims | 38%, SD 68% | ||
These observations, together with the historical information, led us to formulate three specific hypotheses: that many J(xJ2)
chromosomes were introduced into Lebanese Muslims by the Muslim
expansion from the Arabian Peninsula; that some I and R1b chromosomes
were introduced into Lebanese Christians by immigrating European
Christians, perhaps during the time of the Crusades; and that
additional R1b chromosomes were introduced into Lebanese Muslims during
the Ottoman expansion. We do not, of course, imply that these
migrations carried only these haplogroups; obviously, they would have
involved populations containing multiple haplogroups. The signal of
migration, however, should be most readily detected in the highly
differentiated haplogroups. J(xJ2)
was found to be much more frequent in Lebanese Muslims than in Lebanese
non-Muslims (25% vs. 15%, p < 0.0001). The combined I + R1b
frequency was higher in Lebanese Christians than in Lebanese
non-Christians (16% vs. 10%, p = 0.01), as were both of the individual
haplogroups (I: 5.8% vs. 4.0%, p = 0.21; R1b 10% vs. 6.3%, p = 0.03),
although the difference for haplogroup I alone did not reach
statistical significance. The R1b frequency was, however, significantly
lower in Lebanese Muslims than in Lebanese non-Muslims (4.7% vs.
11%, p = 0.0005). The hypotheses of male-mediated gene flow
accompanying the earlier Muslim and Crusader migrations are therefore
supported, but our data provide no evidence for a differential genetic
impact of the Ottoman expansion.
Evidence for Migration from Haplotype Structure
Finally, we investigated the possible origins of the J(xJ2),
I, and R1b chromosomes in more detail by using information from the STR
haplotypes. We visualized STR haplotypes within each haplogroup by
using networks28 constructed with the nine Y-STRs common to all datasets. Geographical structure was seen in the I and R1b networks (Figure3), but not in the J(xJ2)
network. The geographical distributions of Lebanese haplotypes were
then investigated in the Y chromosome Haplotype Reference Database43
(YHRD, release 21) with seven Y-STRs so that 51,253 entries from 447
populations could be interrogated. Of the 30 Lebanese R1b haplotypes,
six (representing seven individuals) were absent from the database, and
22 of the remaining 24 showed distributions that included Europe and
western Asia, as would generally be expected. Most of these haplotypes
thus did not provide more precise subregional information about their
likely place of origin.

Figure3
Network of STR Variation within Haplogroup R1b3Circles represent haplotypes defined by nine STRs; area is proportional to frequency, and color indicates the region of origin. Lines represent the mutational differences between haplotypes.
One
haplotype (WES1, Western European Specific 1), however, stood out for
two reasons. First, it showed a common but strictly western European
distribution among the indigenous populations in the YHRD; it was
present in 26/81 European populations west of Hungary and in zero
populations east of this longitude (Figure4).
Second, and in contrast to its distribution in the database, it was the
most common R1b haplotype in the Lebanese Christians tested (5/27, 19%
of R1b, or about 2% of the total Lebanese Christian haplotypes).
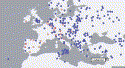
Figure4
Geographical Distribution of WES1, the Most Common R1b Haplotype in Lebanese Christians4This haplotype is DYS19, DYS389I, DYS389b, DYS390, DYS391, DYS392, DYS393 14, 12, 16, 24, 10, 13, 13. Population samples containing the haplotype are shown in red, and those lacking it are shown in blue. Note the highly specific western European distribution and the absence of the haplotype from populations near Lebanon. Data are from YHRD.
Because
this Lebanese occurrence lies far outside the normal range of this
haplotype, we investigated how likely a haplotype was to rise to this
frequency by chance. The first test considered the chances of observing
modern levels of the WES1 haplotype among Lebanese Christians without
any migration. No WES1 members were found in >1,000 Middle Eastern
individuals in the YHRD. Making the highly conservative assumption that
its frequency p0 in the Middle East outside the Lebanese Christians was 0.1% (the maximum observed size consistent with zero in the sample) and a male effective population size of NL
≈1000 for the Lebanese Christians estimated from our data with BATWING,
we calculated the probability of observing the modern fraction f of 2% or more as <0.02 ( Material and Methods). In contrast, given an input of western Europeans, selected from an evolving effective population NE
≈5000, who were carrying WES1 at 0.21% (the weighted average of the
YHRD frequencies from England, France, Germany, and Italy), the
probability of reaching 2% or more among Lebanese Christians exceeded
0.05 for an admixing population fraction m of 10.6% or greater (Table 7). It has been assumed thata total of 32 generations have passed since the start of the admixture event44,
with mixing only during the first seven generations. Thus, WES1 is
likely to have originated in western Europe and shows exactly the
pattern expected for a European lineage introduced by the Crusaders.
| Table 7 Estimated Influence of Historical Western European Admixture on the Frequency of WES1 in Modern Lebanese Christians |
| ma | P(l  0.02 0.02  NL)b NL)b | P(l = 0)c | ||
|---|---|---|---|---|
| 0 | 0.0189 | 0.9425 | ||
| 0.0500 | 0.0325 | 0.9001 | ||
| 0.1000 | 0.0482 | 0.8545 | ||
| 0.1055 | 0.0500 | 0.8492 | ||
| 0.1500 | 0.0656 | 0.8069 | ||
| 0.2000 | 0.0857 | 0.7561 | ||
| 0.3000 | 0.1347 | 0.6465 | ||
| 0.4000 | 0.1998 | 0.5258 | ||
| 0.5000 | 0.2889 | 0.3949 | ||
| a Level of admixture of a western European population (NW = 5,000) carrying WES1 at 0.21% for seven generations to a Lebanese Christian population (NL = 1,000) carrying WES1 at 0.01%. b Probability that WES1 would have reached 2% or more after 32 generations. c Probability that WES1 would have been extirpated after 32 generations. |
Likewise, one can test the question of whether the difference in J(xJ2)
frequencies between Muslims (25%) and non-Muslims (15%) would have
emerged by drift without enhancement during the Islamic expansion from
the Arabian Peninsula by considering the probability that the 15%
frequency could have drifted up to 25% or more by chance in the 42 generations since the Islamic expansion. For an assumed effective population size of 5,000, this is 0.0023, and thus, again, admixture seems likely to have contributed.
Discussion
We find a striking correspondence between documented historical migrations to Lebanon and current patterns of genetic variation within the country. The variation was perhaps initially low or structured by geography but was subsequently accentuated by religion-driven migration into specific communities within Lebanon. Two of the three major migrations have left a detectable impact, and conversely, the main features of the differentiation within Lebanon can be accounted for by these events. It is likely that earlier migratory events have also contributed to the genetic diversity in present-day Lebanese populations, but because these migrations would have occurred before the present religious affiliations and communities were created, they are expected to have shaped the genetic makeup of the country as a whole rather than specific religious subpopulations.
Genetic structuring by religion has been rarely reported in human populations: it was not detectable, for example, among Muslim and Hindu paternal45 or maternal46 lineages in India. A Y-chromosomal lineage that is rare in India but common in western Asia was found at unusually high frequency in an Indian Shiya Muslim sample47, and structuring by religion has been seen among Jewish maternal (although not paternal) lineages48. Such structure might only arise when several unusual criteria are met: migrations based on religion must take place between areas with different representative Y-chromosomal types, and they must establish genetically differentiated communities that remain stable over long time periods. In Lebanon, these conditions appear to have been met for over 1,300 years.
Acknowledgments
We thank all volunteers for participating in this project and Oleg Balanovsky, R. John Mitchell, Fabrício R. Santos, Theodore G. Schurr, and Himla Soodyall for helpful comments. This project was supported in part by a grant from the National Geographic Committee for Research and Exploration; Y.X. and C.T.S. were supported by The Wellcome Trust. We thank Janet Ziegle and Applied Biosystems for providing STR genotyping and QA support. The Genographic Project is supported by funding from the National Geographic Society, IBM, and the Waitt Family Foundation.
Supplemental Data
Web Resources
The URLs for data presented herein are as follows:
Arlequin, http://lgb.unige.ch/arlequin/
Genographic Project, https://www.nationalgeographic.com/genographic/index.html
Network, http://www.fluxus-engineering.com/sharenet.htm
Y Chromosome Haplotype Reference Database (YHRD), http://www.yhrd.org/index.html
Genographic Project, https://www.nationalgeographic.com/genographic/index.html
Network, http://www.fluxus-engineering.com/sharenet.htm
Y Chromosome Haplotype Reference Database (YHRD), http://www.yhrd.org/index.html
References
1 Jobling,M.A., Hurles,M.E., and Tyler-Smith,C. (2004). Human Evolutionary Genetics. (New York:: Garland Science). PubMed
2 Ray, N., and Adams, J.M. (2001) A GIS-based vegetation map of the world at the Last Glacial Maximum. Internet Archaeology 11. http://intarch.ac.uk/journal/issue11/raycdams_toc.html..
3 Hitti,P.K. (1957). Lebanon in History: From the Earliest Times to the Present. (New York: St. Martin's Press). PubMed
4 Harden,D. (1971). The Phoenicians. (London: Penguin Books). PubMed
5 Hourani,A.H. (1946). Syria and Lebanon. (London: Oxford University Press). PubMed
6 Edwards,I.E.S. (19731982). The Cambridge Ancient History, vol. 23. (Cambridge, UK: Cambridge University Press). PubMed
7 Lapidus,I.M. (1999). The Cambridge Illustrated History of the Islamic World. (Cambridge: Cambridge University Press). PubMed
8 Lamb,H. (1930). The Crusades. (New York: Doubleday). PubMed
9 Jobling,M.A., and Tyler-Smith,C. (2003). The human Y chromosome: An evolutionary marker comes of age. Nat. Rev. Genet. 4, 598612. CrossRef | PubMed
10 Luis,J.R., Rowold,D.J., Regueiro,M., Caeiro,B., Cinnioglu,C., Roseman,C., Underhill,P.A., Cavalli-Sforza,L.L., and Herrera,R.J. (2004). The Levant versus the Horn of Africa: Evidence for bidirectional corridors of human migrations. Am. J. Hum. Genet. 74, 532544. Abstract | Full Text | PDF (783 kb) | CrossRef | PubMed
11 Cadenas,A.M., Zhivotovsky,L.A., Cavalli-Sforza,L.L., Underhill,P.A., and Herrera,R.J. (2007). Y-chromosome diversity characterizes the Gulf of Oman. Eur. J. Hum. Genet. 16, 374386. CrossRef | PubMed
12 Semino,O., Passarino,G., Oefner,P.J., Lin,A.A., Arbuzova,S., Beckman,L.E., De Benedictis,G., Francalacci,P., Kouvatsi,A., and Limborska,S., etal. (2000). The genetic legacy of Paleolithic Homo sapiens sapiens in extant Europeans: A Y chromosome perspective. Science 290, 11551159. CrossRef | PubMed
13 Kayser,M., Lao,O., Anslinger,K., Augustin,C., Bargel,G., Edelmann,J., Elias,S., Heinrich,M., Henke,J., and Henke,L., etal. (2005). Significant
genetic differentiation between Poland and Germany follows present-day
political borders, as revealed by Y-chromosome analysis. Hum. Genet. 117, 428443. CrossRef | PubMed
14 Capelli,C., Redhead,N., Abernethy,J.K., Gratrix,F., Wilson,J.F., Moen,T., Hervig,T., Richards,M., Stumpf,M.P., and Underhill,P.A., etal. (2003). A Y chromosome census of the British Isles. Curr. Biol. 13, 979984. CrossRef | PubMed
15 Capelli,C., Brisighelli,F., Scarnicci,F., Arredi,B., Caglia,A., Vetrugno,G., Tofanelli,S., Onofri,V., Tagliabracci,A., Paoli,G., et al. (2007). Y
chromosome genetic variation in the Italian peninsula is clinal and
supports an admixture model for the Mesolithic-Neolithic encounter. Mol. Phylogenet. Evol. 44, 228239. CrossRef | PubMed
16 Cinnioglu,C., King,R., Kivisild,T., Kalfoglu,E., Atasoy,S., Cavalleri,G.L., Lillie,A.S., Roseman,C.C., Lin,A.A., and Prince,K., etal. (2004). Excavating Y-chromosome haplotype strata in Anatolia. Hum. Genet. 114, 127148. CrossRef | PubMed
17 Heath,I. (1978). Armies and Enemies of the Crusades 10961291. (Sussex, UK: Wargames Research Group). PubMed
18 Riley-Smith,J. (1991). The Atlas of the Crusades. (New York, Oxford: Facts on File). PubMed
19 Runciman,S. (1964). A History of the Crusades, 3 vols. (New York: Harper Torchbooks). PubMed
20 Xue,Y., Zerjal,T., Bao,W., Zhu,S., Shu,Q., Xu,J., Du,R., Fu,S., Li,P., and Hurles,M.E., etal. (2006). Male demography in East Asia: A north-south contrast in human population expansion times. Genetics 172, 24312439. PubMed
21 Ayub,Q., Mohyuddin,A., Qamar,R., Mazhar,K., Zerjal,T., Mehdi,S.Q., and Tyler-Smith,C. (2000). Identification and characterisation of novel human Y-chromosomal microsatellites from sequence database information. Nucleic Acids Res. 28, e8. PubMed
22 Thomas,M.G., Bradman,N., and Flinn,H.M. (1999). High throughput analysis of 10 microsatellite and 11 diallelic polymorphisms on the human Y-chromosome. Hum. Genet. 105, 577581. CrossRef | PubMed
23 Gusmao,L., Butler,J.M., Carracedo,A., Gill,P., Kayser,M., Mayr,W.R., Morling,N., Prinz,M., Roewer,L., Tyler-Smith,C., et al. (2006). DNA
Commission of the International Society of Forensic Genetics (ISFG): an
update of the recommendations on the use of Y-STRs in forensic analysis. Int. J. Legal Med. 120, 191200. CrossRef | PubMed
24 Excoffier,L., Smouse,P.E., and Quattro,J.M. (1992). Analysis
of molecular variance inferred from metric distances among DNA
haplotypes: Application to human mitochondrial DNA restriction data. Genetics 131, 479491. PubMed
25 Mantel,N. (1967). The detection of disease clustering and a generalized regression approach. Cancer Res. 27, 209220. PubMed
26 Schneider,S., Roessli,D., and Excoffier,L. (2000). Arelquin: a software for population genetics data analysis release 2. (Geneva, Switzerland: Genetics and Biometry Lab, Department of Anthropology, University of Geneva). PubMed
27 Dupanloup,I., and Bertorelle,G. (2001). Inferring admixture proportions from molecular data: extension to any number of parental populations. Mol. Biol. Evol. 18, 672675. PubMed
28 Bandelt,H.J., Forster,P., and Röhl,A. (1999). Median-joining networks for inferring intraspecific phylogenies. Mol. Biol. Evol. 16, 3748. PubMed
29 Qamar,R., Ayub,Q., Mohyuddin,A., Helgason,A., Mazhar,K., Mansoor,A., Zerjal,T., Tyler-Smith,C., and Mehdi,S.Q. (2002). Y-chromosomal DNA variation in Pakistan. Am. J. Hum. Genet. 70, 11071124. Abstract | Full Text | PDF (1445 kb) | CrossRef | PubMed
30 Bandelt,H.J., Forster,P., Sykes,B.C., and Richards,M.B. (1995). Mitochondrial portraits of human populations using median networks. Genetics 141, 743753. PubMed
31 Wilson,I.J., Weale,M.E., and Balding,D.J. (2003). Inferences from DNA data: population histories, evolutionary processes and forensic match probabilities. J. R. Stat. Soc. Ser. A Stat. Soc. 166, 155188. PubMed
32 Beerli,P. (1998). Estimation of migration rates and population sizes in geographically structured populations. In Advances in Molecular Ecology; NATO-ASI Workshop Series. Carvalho,G., ed. (Amsterdam: IOS Press), pp.3953. PubMed
33 Beerli,P., and Felsenstein,J. (1999). Maximum-likelihood estimation of migration rates and effective population numbers in two populations using a coalescent approach. Genetics 152, 763773. PubMed
34 Beerli,P., and Felsenstein,J. (2001). Maximum
likelihood estimation of a migration matrix and effective population
sizes in n subpopulations by using a coalescent approach. Proc. Natl. Acad. Sci. USA 98, 45634568. CrossRef | PubMed
35 Hey,J., and Nielsen,R. (2007). Integration within the Felsenstein equation for improved Markov chain Monte Carlo methods in population genetics. Proc. Natl. Acad. Sci. USA 104, 27852790. CrossRef | PubMed
36 Kuhner,M.K. (2006). LAMARC 2.0: Maximum likelihood and Bayesian estimation of population parameters. Bioinformatics 22, 768770. PubMed
37 Kuhner,M.K., and Smith,L.P. (2007). Comparing likelihood and Bayesian coalescent estimation of population parameters. Genetics 175, 155165. PubMed
38 Nielsen,R., and Wakeley,J. (2001). Distinguishing migration from isolation: A Markov chain Monte Carlo approach. Genetics 158, 885896. PubMed
39 Fisher,R.A. (1930). The Genetical Theory of Natural Selection. (New York: Oxford University Press). PubMed
40 Wright,S. (1931). Evolution in Mendelian populations. Genetics 16, 97159. PubMed
41 Haldane,J.B.S. (1930). A mathematical theory of natural and artificial selection: VI. Isolation. Proc. Camb. Philol. Soc. 26, 220230. PubMed
42 GSL Gnu Scientific Library. ver 1.10. Free Software Foundation, http://www.gnu.org/software/gsl/..
43 Willuweit,S., and Roewer,L. (2007). Y chromosome haplotype reference database (YHRD): update. FSI Genet. 1, 8387. PubMed
44 Fenner,J.N. (2005). Cross-cultural estimation of the human generation interval for use in genetics-based population divergence studies. Am. J. Phys. Anthropol. 128, 415423. CrossRef | PubMed
45 Gutala,R., Carvalho-Silva,D.R., Jin,L., Yngvadottir,B., Avadhanula,V., Nanne,K., Singh,L., Chakraborty,R., and Tyler-Smith,C. (2006). A shared Y-chromosomal heritage between Muslims and Hindus in India. Hum. Genet. 120, 543551. PubMed
46 Terreros,M.C., Rowold,D., Luis,J.R., Khan,F., Agrawal,S., and Herrera,R.J. (2007). North Indian Muslims: enclaves of foreign DNA or Hindu converts?. Am. J. Phys. Anthropol. 133, 10041012. CrossRef | PubMed
47 Agrawal,S., Khan,F., Pandey,A., Tripathi,M., and Herrera,R.J. (2005). YAP, signature of an African-Middle Eastern migration into northern India. Curr. Sci. 88, 19771980. PubMed
48 Thomas,M.G., Weale,M.E., Jones,A.L., Richards,M., Smith,A., Redhead,N., Torroni,A., Scozzari,R., Gratrix,F., and Tarekegn,A., etal. (2002). Founding
mothers of Jewish communities: geographically separated Jewish groups
were independently founded by very few female ancestors. Am. J. Hum. Genet. 70, 14111420. Abstract | Full Text | PDF (112 kb) | CrossRef | PubMed
Publication Information
Received: November 28, 2007
Revised: January 25, 2008
Accepted: January 28, 2008
Published online: March 27, 2008
Article Information
PubMed
Related Articles
- Mutations in FGD4 Encoding the Rho GDP/GTP Exchange Factor F...Mutations in FGD4 Encoding the Rho GDP/GTP Exchange Factor FRABIN Cause Autosomal Recessive Charcot-Marie-Tooth Type 4H

The American Journal of Human Genetics, Volume 81, Issue 1, 1 July 2007, Pages 1-16
Valérie Delague, Arnaud Jacquier, Tarik Hamadouche, Yannick Poitelon, Cécile Baudot, Irène Boccaccio, Eliane Chouery, Malika Chaouch, Nora Kassouri, Rosette Jabbour, Djamel Grid, André Mégarbané, Georg Haase and Nicolas Lévy
AbstractCharcot-Marie-Tooth (CMT) disorders are a clinically and genetically heterogeneous group of hereditary motor and sensory neuropathies characterized by muscle weakness and wasting, foot and hand deformities, and electrophysiological changes. The CMT4H subtype is an autosomal recessive demyelinating form of CMT that was recently mapped to a 15.8-Mb region at chromosome 12p11.21-q13.11, in two consanguineous families of Mediterranean origin, by homozygosity mapping. We report here the identification of mutations in FGD4, encoding FGD4 or FRABIN (FGD1-related F-actin binding protein), in both families. FRABIN is a GDP/GTP nucleotide exchange factor (GEF), specific to Cdc42, a member of the Rho family of small guanosine triphosphate (GTP)binding
proteins (Rho GTPases). Rho GTPases play a key role in regulating
signal-transduction pathways in eukaryotes. In particular, they have a
pivotal role in mediating actin cytoskeleton changes during cell
migration, morphogenesis, polarization, and division. Consistent with
these reported functions, expression of truncated FRABIN mutants in rat
primary motoneurons and rat Schwann cells induced significantly fewer
microspikes than expression of wild-type FRABIN. To our knowledge, this
is the first report of mutations in a Rho GEF protein being involved in
CMT.
Abstract | Full Text | PDF(11401 kb) - Mapping of a New Locus for Autosomal Recessive Demyelinating...Mapping of a New Locus for Autosomal Recessive Demyelinating Charcot-Marie-Tooth Disease to 19q13.1-13.3 in a Large Consanguineous Lebanese Family: Exclusion of MAG as a Candidate Gene
The American Journal of Human Genetics, Volume 67, Issue 1, 1 July 2000, Pages 236-243
Valérie Delague, Corinne Bareil, Sylvie Tuffery, Patrice Bouvagnet, Eliane Chouery, Salam Koussa, Thierry Maisonobe, Jacques Loiselet, André Mégarbané and Mireille Claustres
AbstractAutosomal recessive Charcot-Marie-Tooth disease (CMT) type 4 (CMT4) is a complex group of demyelinating hereditary motor and sensory neuropathies presenting genetic heterogeneity. Five different subtypes that correspond to six different chromosomal locations have been described. We hereby report a large inbred Lebanese family affected with autosomal recessive CMT4, in whom we have excluded linkage to the already-known loci. The results of a genomewide search demonstrated linkage to a locus on chromosome 19q13.1-13.3, over an 8.5-cM interval between markers D19S220 and D19S412. A maximum pairwise LOD score of 5.37 for marker D19S420, at recombination fraction [ ] .00, and a multipoint LOD score of 10.3 for marker D19S881, at =.00,
strongly supported linkage to this locus. Clinical features and the
results of histopathologic studies confirm that the disease affecting
this family constitutes a previously unknown demyelinating autosomal
recessive CMT subtype known as CMT4F.
The myelin-associated glycoprotein (MAG) gene, located on 19q13.1 and
specifically expressed in the CNS and the peripheral nervous system,
was ruled out as being the gene responsible for this form of CMT.
] .00, and a multipoint LOD score of 10.3 for marker D19S881, at =.00,
strongly supported linkage to this locus. Clinical features and the
results of histopathologic studies confirm that the disease affecting
this family constitutes a previously unknown demyelinating autosomal
recessive CMT subtype known as CMT4F.
The myelin-associated glycoprotein (MAG) gene, located on 19q13.1 and
specifically expressed in the CNS and the peripheral nervous system,
was ruled out as being the gene responsible for this form of CMT.
Abstract | Full Text | PDF(483 kb) - Disruption of POF1B Binding to Nonmuscle Actin Filaments Is ...Disruption of POF1B Binding to Nonmuscle Actin Filaments Is Associated with Premature Ovarian Failure
The American Journal of Human Genetics, Volume 79, Issue 1, 1 July 2006, Pages 113-119
Arnaud Lacombe, Hane Lee, Laila Zahed, Mahmoud Choucair, Jean-Marc Muller, Stanley F. Nelson, Wael Salameh and Eric Vilain
AbstractPremature ovarian failure (POF) is characterized by elevated gonadotropins and amenorrhea in women aged <40 years. In a Lebanese family with five sisters who received the diagnosis of POF, we established linkage to the long arm of the X chromosome (between Xq21.1 and Xq21.3.3), using whole-genome SNP typing and homozygosity-by-descent mapping. By sequencing one candidate gene within that region, POF1B, we identified a point mutation localized in exon 10. This substitution of a nucleotide (G A), at position 1123, results in an arginineglutamine
mutation of the protein sequence at position 329 (mutation R329Q). All
the affected family members were homozygous for the mutation, whereas
the unaffected members were heterozygous. Because POF1B shares high
homology with the tail portion of the human myosin, we assessed the
ability of both wild-type and mutant POF1B proteins to bind nonmuscle
actin filaments in vitro. We found that the capacity of the mutant
protein to bind nonmuscle actin filaments was diminished fourfold
compared with the wild type, suggesting a function of POF1B in
germ-cell division. Our study suggests that a homozygous point mutation
in POF1B influences the pathogenesis of POF by altering POF1B binding
to nonmuscle actin filaments.
A), at position 1123, results in an arginineglutamine
mutation of the protein sequence at position 329 (mutation R329Q). All
the affected family members were homozygous for the mutation, whereas
the unaffected members were heterozygous. Because POF1B shares high
homology with the tail portion of the human myosin, we assessed the
ability of both wild-type and mutant POF1B proteins to bind nonmuscle
actin filaments in vitro. We found that the capacity of the mutant
protein to bind nonmuscle actin filaments was diminished fourfold
compared with the wild type, suggesting a function of POF1B in
germ-cell division. Our study suggests that a homozygous point mutation
in POF1B influences the pathogenesis of POF by altering POF1B binding
to nonmuscle actin filaments.
Abstract | Full Text | PDF(948 kb)  more
more
